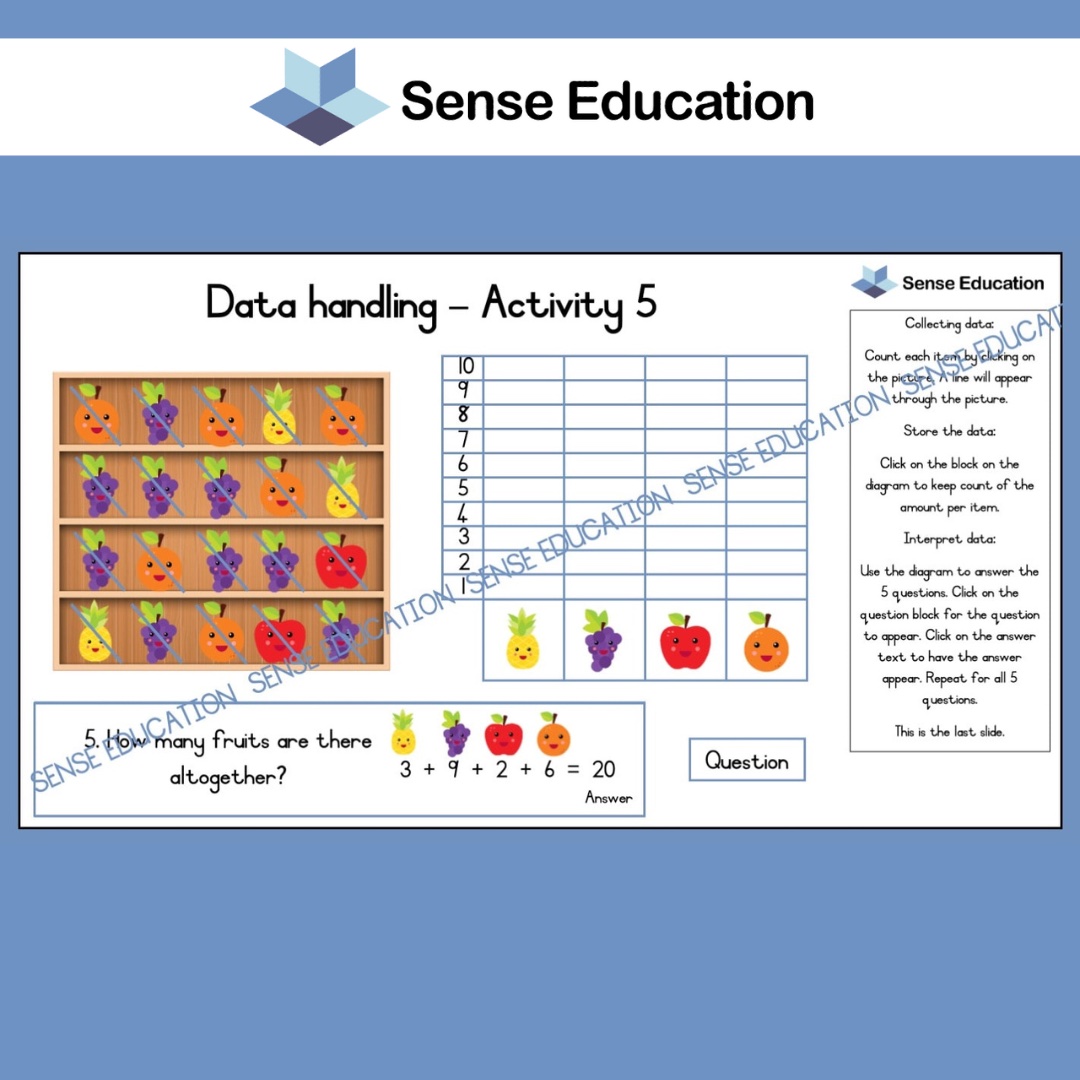
Various themes – basic Data Handling graphs
R109.25
Use, by you or one client, in a single end product which end users are not charged for. The total price includes the item price and a buyer fee.
Resource Description
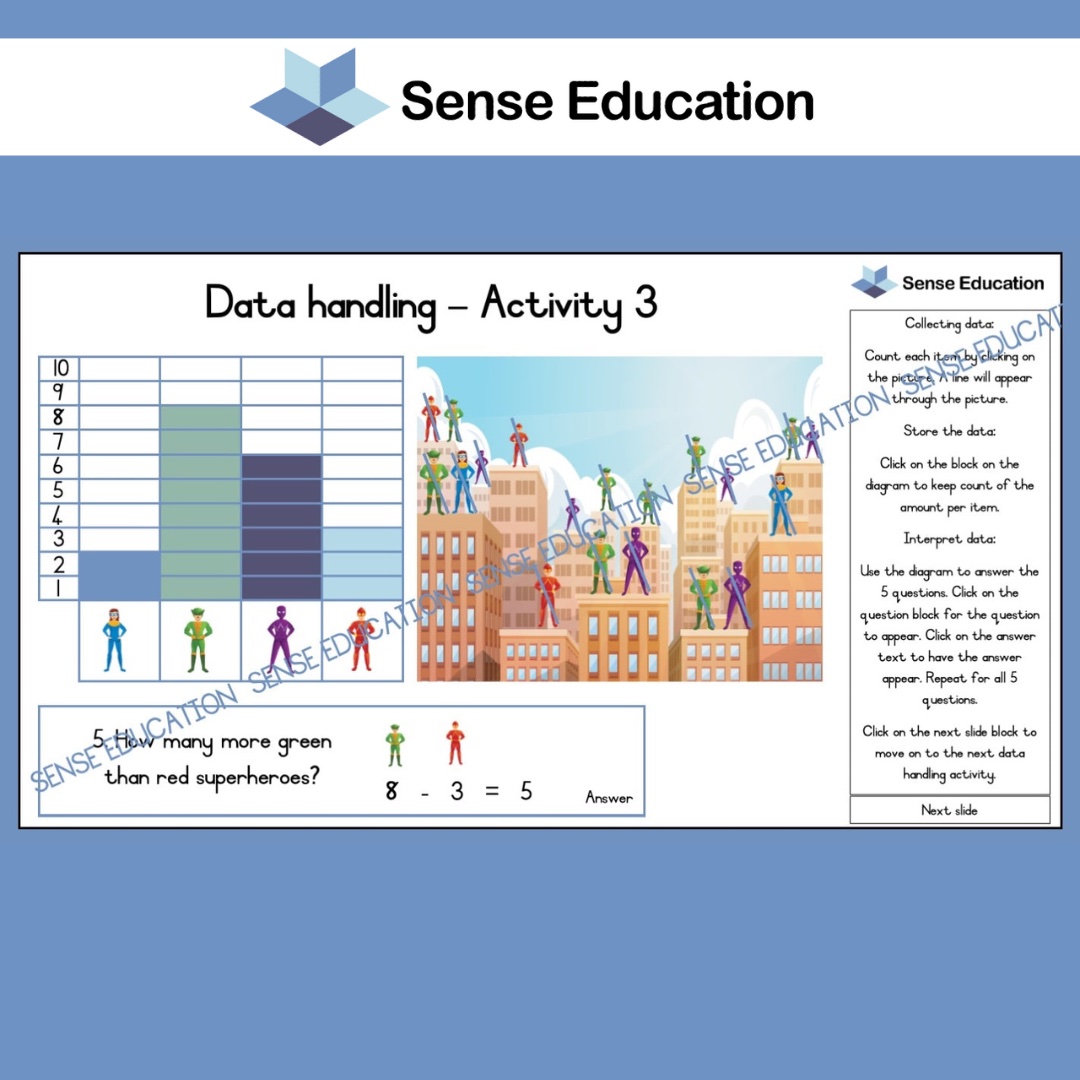
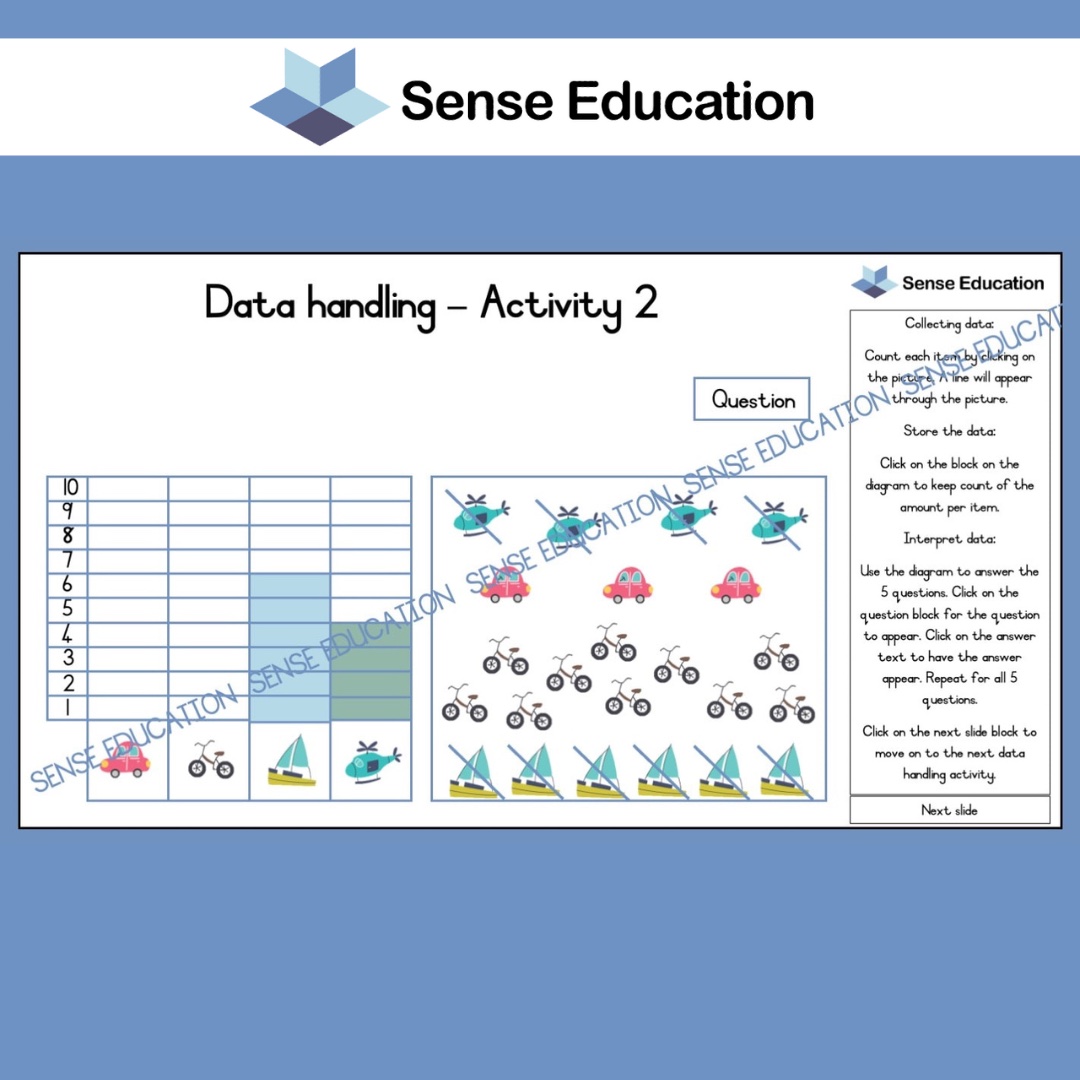
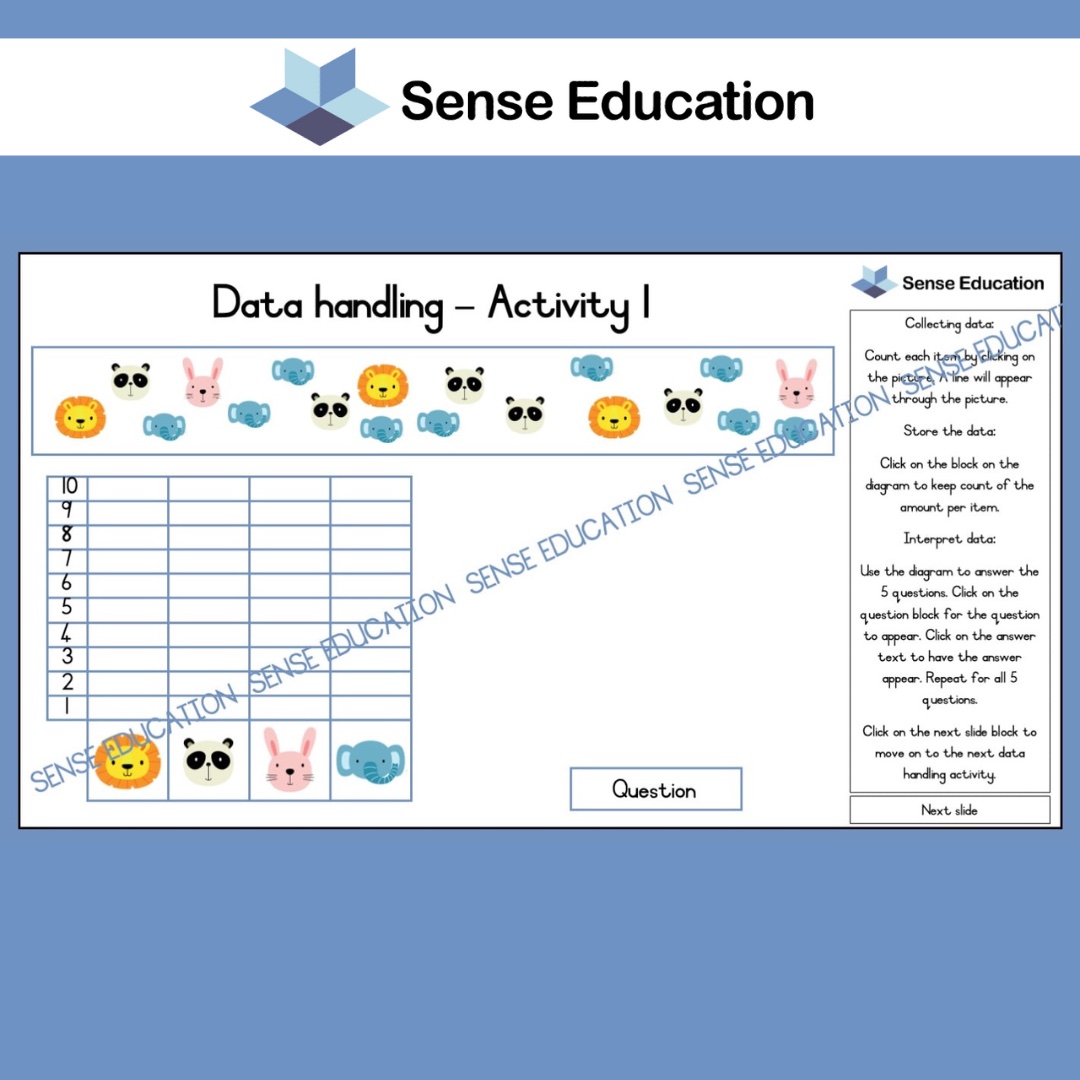
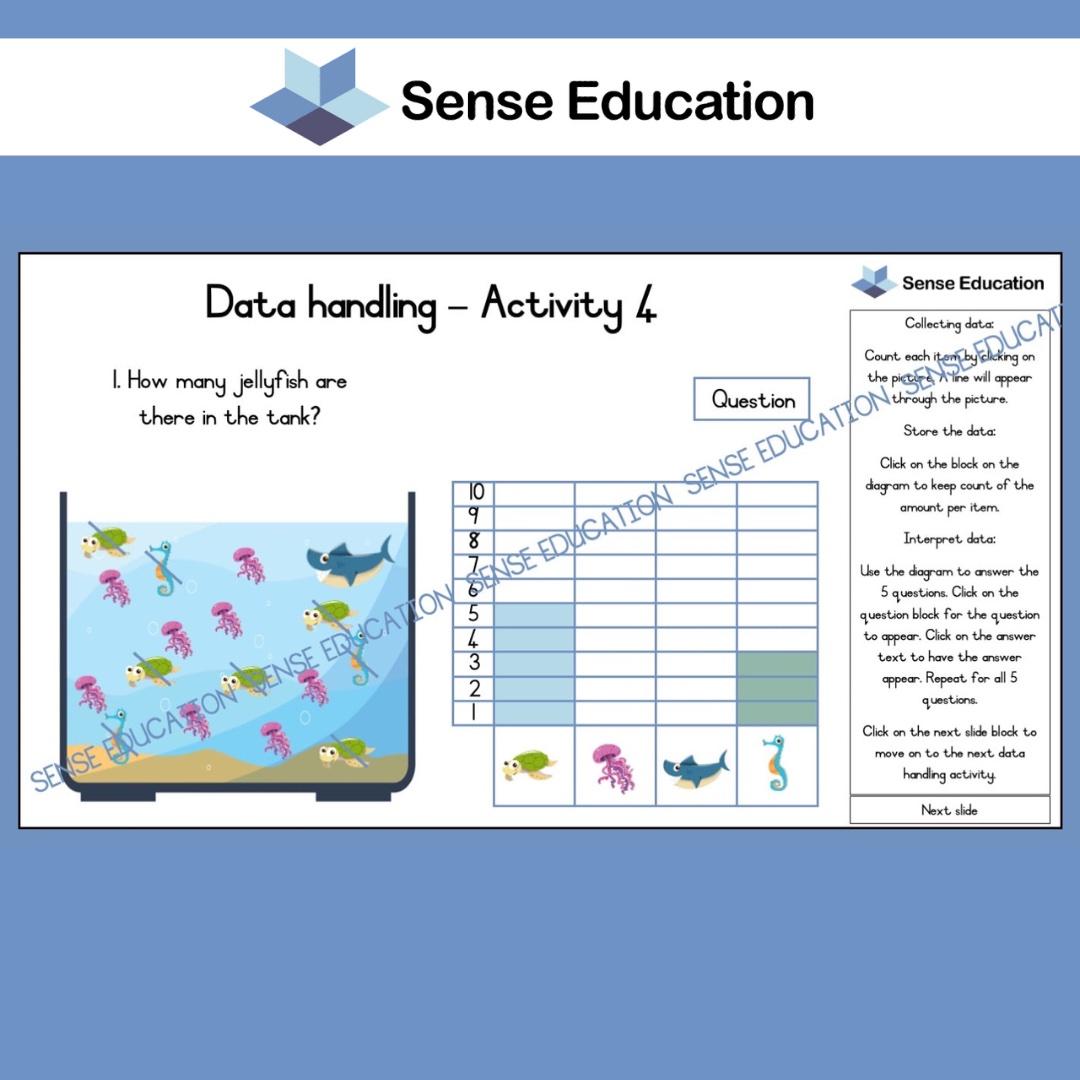
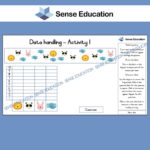
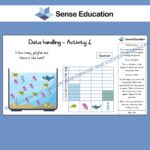
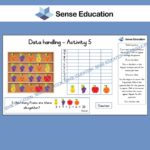
Animals, transport, superheroes, sea animals and fruit are all the kinds of themes you can find in this lesson. It is practical and visual for all learners to understand how to work with basic graphs.
This interactive lesson consists of:
– Collecting data for a graph, up to number 10
– Representing data in a bar graph
– Interpreting data by answering questions on the graph
That was so much fun! Thank you for joining us.
*Post a picture or video of the learners interacting with our content and share it on social media. Make sure to tag Sense Education so that others can see how learning can be fun.
Slides: 5
Subject: Mathematics
Content: Data Handling
Format Type: PowerPoint Presentation
Suitable for: Grade 1 – 2
Group size: Unlimited
Copyright: Sense Education 2022


 KES(KSh)
 USD($)
 GBP(£)
 GHS(₵)
 NGN(₦)
 MUR(₨)
 BWP(P)
 AUD($)
 TZS(Sh)
 INR(₹)
 PHP(₱)
 AED(د.إ)