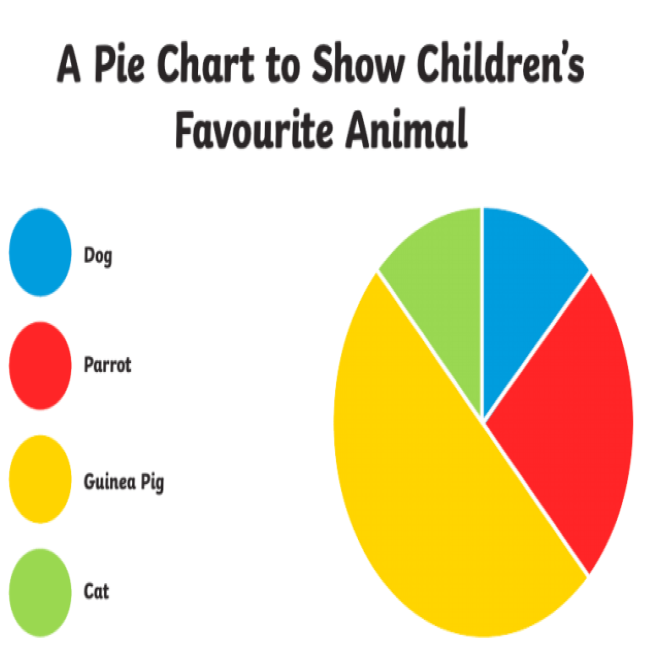
Grade 6 Maths: Data Handling in animated PowerPoint.
$2
Use, by you or one client, in a single end product which end users are not charged for. The total price includes the item price and a buyer fee.
Resource Description
This section covers the following topics:
- Collecting and organizing data
- Keywords: data, questionnaires & tables
- Working with pictographs
- Working with bar graphs
- Drawing a bar graph
- Drawing a double bar graph
- Mode & mean of a set of data
- Interpreting graphs
- Interpreting & analyzing data
- Comparing graphs on the same topic
- Probability
- Keywords: experiment, trial & outcome
- Toss of a coin, throwing a dice & spinning a wheel
- Recording outcomes
- The scale of probability
These slides should be used with a laptop and data projector for your daily classroom teaching.
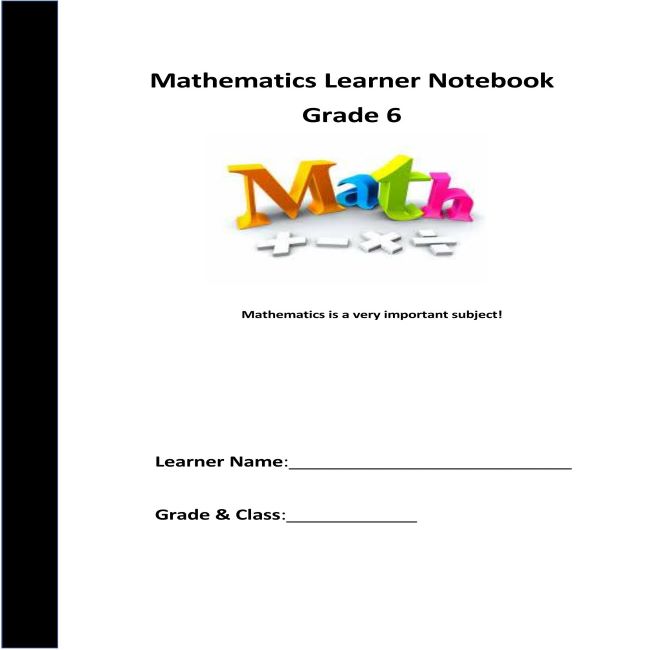
For maximum pedagogical benefit, access the Learner Notebook from our shop (for FREE!), download and print a copy for each of your learners to use in class & for studying for tests & exams during the year.


 KES(KSh)
 USD($)
 GBP(£)
 GHS(₵)
 NGN(₦)
 MUR(₨)
 BWP(P)
 AUD($)
 TZS(Sh)
 INR(₹)
 PHP(₱)
 AED(د.إ)


