Grade 7 Maths: Representing and analyzing data in animated PowerPoint.
R31.63
Use, by you or one client, in a single end product which end users are not charged for. The total price includes the item price and a buyer fee.
Resource Description
This section covers the following topics:
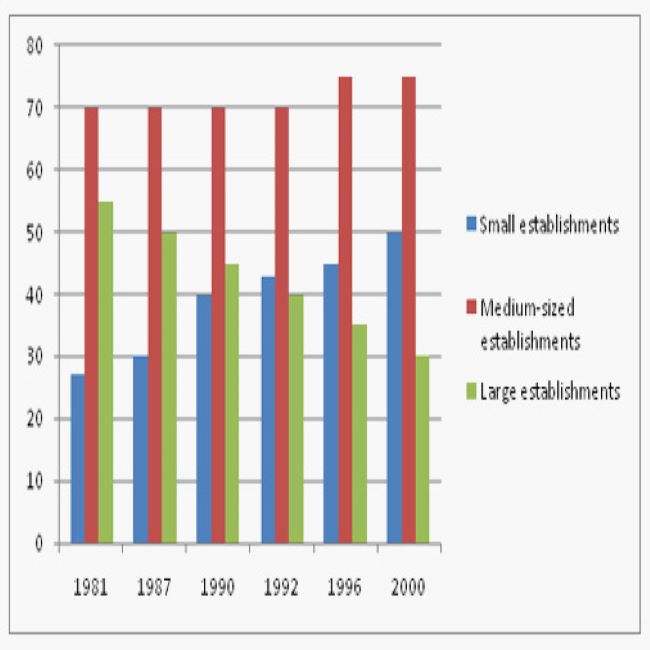
- Representing data – problem, plan, collect, summarize, represent & interpret
- Key words: Bar graphs, double bar graphs, histograms & pie charts
- Vertical bar graph
- Vertical double bar graph
- Histogram
- Pie charts
- Interpreting & analyzing
- Completing an exercise and answering questions.
Sample questions with answers
These slides should be used with a laptop and data projector for your daily classroom teaching
For maximum pedagogical benefit, access the Learner Notebook from our shop (for FREE!), download and print a copy for each of your learners to use in class & for studying for tests & exams during the year.


 KES(KSh)
 USD($)
 GBP(£)
 GHS(₵)
 NGN(₦)
 MUR(₨)
 BWP(P)
 AUD($)
 TZS(Sh)
 INR(₹)
 PHP(₱)
 AED(د.إ)


